

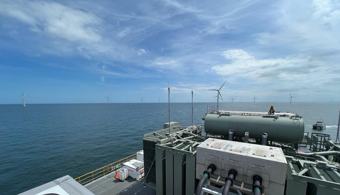
James Fisher secures commissioning contract worth over one million pounds at Zhong Neng offshore wind farm in Taiwan
Read article

Review the historical financial performance of James Fisher and Sons plc.
| Financial information | James Fisher and Sons plc |
| Primary country listing | UK |
| Status | Fully listed |
| FTSE sector | Industrial Transportation |
| FTSE index | FTSE All-share, FTSE 350 Low Yield, FTSE 250, FTSE All-Share (ex IT), FTSE 350 (ex IT), FTSE MID 250 (ex IT), FTSE 350 |
| TIDM | FSJ |
| Ordinary shares in issue | 50,398,063 |
| Overview | Year ended 31 December 2023 Total £m | Year ended 31 December 2022 Total £m |
| Revenue | 496.2 | 478.1 |
| Operating profit/(loss) | (18.6) | 24.7 |
| Profit/(loss) before taxation | (39.9) | 14.5 |
| Profit/(loss) for the year from continuing operations | (50.9) | 9.0 |
| Loss per share | Year ended 31 December 2023 pence |
Year ended 31 December 2022 restated* pence |
| Basic | (123.9) | (22.1) |
| Diluted | (123.9) | (22.1) |
| Profit/(loss) per share - continuing activities | Year ended 31 December 2023 pence |
Year ended 31 December 2022 pence |
| Basic | (101.2) | 17.4 |
| Diluted | (101.2) | 17.4 |
As a result of performance challenges, the Company did not pay an interim dividend for 2023, and the Board is not recommending the payment of a final dividend for the year. The Board is committed to reinstating the dividend when appropriate.
For detailed share price information view our share price summary and chart.


Sign up to regulatory news services (RNS) alerts from James Fisher and Sons plc (LSE: FSJ).
Discover the latest stories from across James Fisher


 Annual Report 2023